
Chapter 3 - Winds
Wind is another meteorological element that is extremely important in the study of weather. It can be defined as the horizontal movement of air. Wind is nature's way of correcting unequal pressures across the earth's surface.
Surface Winds and Weather Forecasting
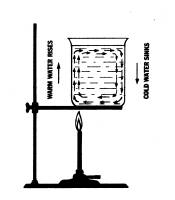
The cause of a wind can be explained by comparing our atmosphere with a beaker of water. When heat is applied to the left side of the beaker below, the water is heated, becomes less dense, and begins to rise. Water from the right side of the beaker moves to the left to replace the rising water. Thus water is set in motion.
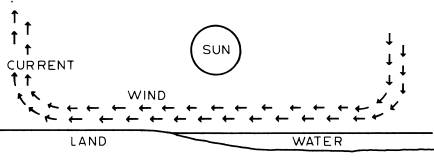
During the daytime, land heats up more quickly than water and the air over the land becomes an area of low pressure. This air, heated from below, begins to rise. The cooler air over the water rushes toward the land, replacing the rising air. At the same time, the cooler air above the water sinks. Thus the air is set in motion and a wind circulation is produced.
Note that winds always blow from regions of cooler temperatures (high pressure) to regions of warmer temperatures (low pressure). The greater the differences in temperatures or pressures the higher the wind speed. This means that winds that blow from regions of higher pressure to regions of lower pressure are strong, while gentle pressure differences create weak winds.
Our atmosphere reacts in the same manner as the water in the beaker. Unequal heating of the surface causes unequal pressures, which in turn initiate movement of air as shown below.
Instruments For Measuring Wind
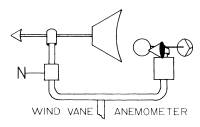
The instrument used to indicate the direction of the surface wind is the wind vane. The simplest wind vane consists of an arrow and "feather," balanced and mounted horizontally on a vertical shaft. The shaft usually is set in ball bearings or some other low-friction device to allow the vane to respond to the slightest breeze.
As the wind blows against the "feather," it turns the arrow into the wind so that the arrow points into the direction from which the wind is coming.
The anemometer indicates the speed of the wind. The cup anemometer consists of a set of metal cups or hollow cones, all mounted to face the same way. These cups are attached to spokes that, in turn, are mounted on a shaft set in bearings to allow free movement. The cups catch the wind on their open sides. The stronger the wind, the faster the cups turn; subsequently, the higher the reading of the instrument.
Wind Names, Directions, And Resulting Weather
A wind is named according to the direction from which it blows. A wind coming from the west is a west wind; a wind or breeze coming from the sea is a sea breeze; a wind blowing up a mountain from the valley is a valley breeze.
There is usually a definite connection between the direction of the wind and the resulting weather conditions. Winds generally transport the weather characteristics of the regions from which they blow. For example, in the United States, winds with a northerly component come from higher latitudes and bring colder weather. Southerly winds, on the other hand, bring warmer weather. Along the east coast of the United States, easterly winds bring moisture onshore. In the wintertime, easterly winds bring warmer temperatures; in the summer, these same easterly winds bring cooler weather. Westerly winds along the east coast of the United States produce dry weather because they are coming from the interior of the continent. During the winter, westerly winds can be quite cold; during the summer, they are generally warm or hot. Along the west coast of the United States, the opposite is true. Westerly winds can bring moisture-laden air since they blow in from the Pacific Ocean.
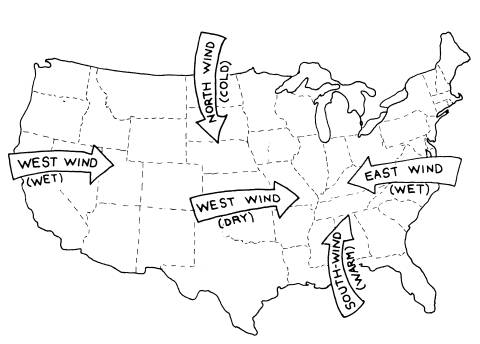
Winds from the northwest generally bring cooler and drier weather to the eastern United States, while southwesterly winds bring warmer and drier weather. During the winter months, southeasterly winds produce rainy, but warmer, weather along the east coast. Using these basic rules, it is possible to predict future weather if location and time of year are considered.
Decoding And Plotting Winds
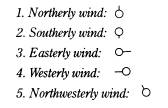
Wind directions are shown on weather maps with arrows or "sticks" attached to station models that point into the direction from which the wind is coming. For example, wind directions would be indicated as shown in the chart below.
Speeds are represented by "feathers" or "flags" placed on the "clockwise" side of the shaft. Each full feather represents a speed of about 10 knots while a half-feather indicates about 5 knots. A "flag" with 5 feathers represents a speed of 50 knots.
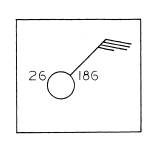
The station model to the left is showing a temperature of 26°F, an air pressure of 1018.6 mb. and a northeast wind of 35 knots. A circle around the station model would indicate calm winds.
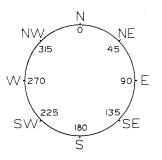
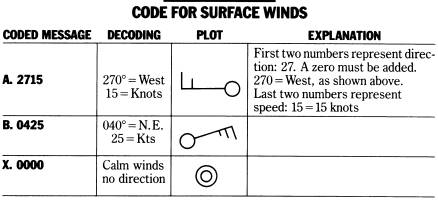
Weather data transmitted to weather stations around the country via telecommunications is in coded form. This information must be decoded before it is plotted on weather maps. The direction of winds is given in "degrees from north"; thus the compass points below must be understood.
Direction Of Surface Winds Around Pressure Systems
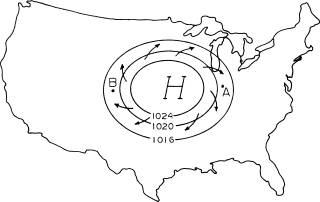
Winds around surface high-pressure systems rotate clockwise in the northern hemisphere and are deflected away from the center as shown below. In the center of a high-pressure system, the winds are light and variable in direction or even stable. Cities, such as Indianapolis, Indiana (A), located in the eastern sections of this high-pressure system, would experience northwesterly winds. These winds would sweep colder and drier air into the region. Locations to the west of the high-pressure center, such as Denver, Colorado (B), would experience southeasterly winds. Southeasterly winds would eventually bring warmer and wetter weather into the area. Wind directions can be determined for all areas affected by this high-pressure system.
In low-pressure systems, winds rotate counterclockwise and are deflected toward the center by friction. In the map below, cities such as Indianapolis, Indiana (A), located in the eastern sections of this low-pressure system would experience southeasterly winds. These winds would bring warmer and wetter weather into the region. In the western sections of the low-pressure system, such as Denver, Colorado (B), the winds would be northwesterly. Colder and drier weather would sweep into the region. Wind directions can be determined for all areas affected by this low-pressure system.

Wind Directions Change As Systems Move
High-pressure systems and low-pressure systems do not remain stationary. They are usually on the move across the country. This movement of systems is the major cause of shifting wind directions.
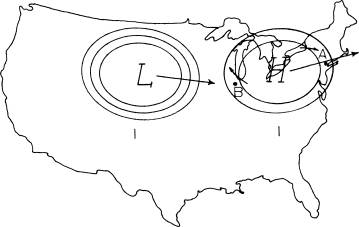
The map below shows pressure systems advancing across the country from west to east. The northeastern part of the United States is being dominated by high-pressure. The wind direction in New York City (A) is northwesterly. In Chicago (B) winds are southeasterly around the back of the high.
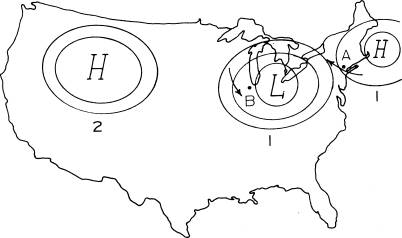
On the following day, as shown in the map below, high-pressure system #1 has moved off the east coast. The wind direction in New York City has shifted from the northwesterly direction of yesterday to a southeasterly direction today. This is the result of the high-pressure system moving out and the low-pressure system moving in. Meanwhile Chicago (B) has had a wind shift from southeasterly yesterday to northwesterly today as a result of low-pressure system #1 moving east.
Accurate weather forecasts can be made only when one knows in what direction pressure systems will move and at what speed they will travel. Only then can one correctly forecast wind directions.
An experienced meteorologist can tell, at a glance, the present wind directions and those that will result after the pressure systems move. In addition, he/she can estimate the speed of the wind by measuring the distance between the isobars. So now it is possible for you to understand how the forecaster in a weather station works!
From the following map we can see, as high-pressure system #1 moves off to the east, surface winds blow from the southeast. Southeasterly winds in many sections of the United States eventually bring in moisture from the Gulf of Mexico and the Atlantic Ocean.
Local Wind Systems
Local pressure differences because of uneven heating of surfaces in adjacent areas are responsible for local winds. Land and sea breezes as well as mountain and valley breezes are all classified as local winds.
Land and Sea Breezes: During the daytime hours, land areas begin to warm up more rapidly than adjacent water areas as illustrated below.
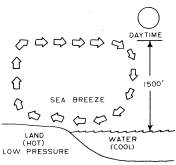
By approximately 11 A.M., an area of lower pressure is created by surface heating and a gentle breeze begins to blow toward the land. The air over the water, being cool, remains an area of high-pressure. This breeze, blowing from higher pressure (water) to lower pressure (land) increases in velocity until mid-afternoon. During summer afternoons this is known as a sea breeze. As the sun dips closer to the horizon during the late afternoon hours, the land begins to cool and the breeze slackens, usually dying down around sunset.
Sea breezes bring relief from the heat on those sunny days, dropping the temperatures as much as 15°-20°. Of course, the greatest cooling is experienced along the immediate shoreline, with decreased cooling further inland, but their cooling effects are diminished as they pass over the warm land.
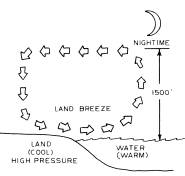
Land breezes occur at night. Rapid nocturnal cooling, or radiation, of the land causes high-pressure to develop over land. The air over ocean waters, retaining its heat, becomes warmer than adjacent air over land areas and develops relatively lower pressure. A gentle flow of air from the land to the ocean commences, usually around midnight, dying down toward sunrise. Land breezes are not as strong as sea breezes.
The Jet Stream
The Jet Stream is a narrow, meandering belt of high-speed winds, snaking through the sky at altitudes of 30, 000 - 40, 000 feet. The Jet Stream is erratic in speed, direction and altitude but usually can be found meandering from west to east. Speeds up to 400 mph have been recorded. Much turbulence is experienced along its "edges," making the Jet Stream important in aviation. Since the Jet Stream exists where cold polar air meets warm tropical air, it is also important to the meteorologist since this zone is one where storms often develop. The Jet Stream will be discussed in greater detail in connection with storm development and intensification.
Wind Chill Factor
The wind chill factor is simply a measure of how cold you may feel - no matter what the thermometer shows. For instance, if the temperature is 0° with still air, we do not lose body heat as rapidly as we do when the temperature is 20° and the wind is blowing at 18 mph. This illustrates how wind adds to the chilling effect of temperature. However, it must be remembered, that all people do not experience exactly the same reaction to this type of exposure. Obviously, there are many other factors involved, such as physical condition, individual metabolism, and clothing.
Studies show that the heat lost by the surface of the body due to wind and temperature can be estimated by multiplying a factor for the wind (which gets higher as the wind increases) and a factor for temperature (which gets higher as the temperature decreases). The resulting Wind Chill Index number is a good guide to decide what clothing will be needed for protection against the cold. To help in evaluating the Wind Chill Index, the following scale compares a 20°F temperature with different wind speeds.
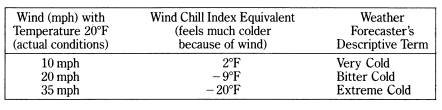
The Wind Chill Table below is an excellent tool for practical use. For instance, if a weather broadcast reports the temperature of 30°F with a 10 mph wind, the chart shows that this is equivalent to 16°F and you should dress accordingly. With the same 30°F temperature but with a 20 mph wind, the equivalent effect would be down to 3°F. Only in a still atmosphere would the 30°F feel like 30°F.

As you can see, the winds are a very important factor in the study of weather. Directional changes can turn warm summerlike weather into bitter cold in a matter of hours. Meteorologists constantly watch the direction and speed of winds as they prepare forecasts for a period of several days.