
Advanced Weather Forecasting
This section is designed to serve as a ready reference to common forecasting situations. Some of the techniques offered appear very simple. They are presented as they have been found to be operationally very successful.
Forecasting Maximum and Minimum Temperatures
Upstream Weather
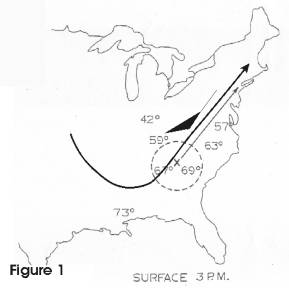
Maximum temperatures usually occur at about 2 P.M. or 3 P.M. while minimum temperatures occur around sunrise or just after sunrise. (6 A.M.) To determine tomorrow's maximum temperature, examine today's 2 P.M. or 3 P.M. surface map. Calculate, using ½ the speed of the 500 MB winds the parcel of air that will be influencing your area 24 hours later. The temperatures in that parcel will very closely resemble tomorrow's maximum temperature in your area. Local variations must be studied and then introduced into each forecast.
Since the 500 MB winds are from the southwest at 50 kts. weather which is now 600 miles (1/2 50 X 24 hours) to our southwest will influence our area tomorrow at 3 p.m. Since most of the upstream temperatures are in the upper 60's, temperatures in the upper 60's are likely for the forecast area the next day.
Minimum Temperatures
The procedure for minimum temperatures is exactly the same as for maximum temperatures with one exception. Instead of using a 3 P.M. surface map, the 6 A.M. or 7 A.M. surface map should be used. Employ the same upstream procedures and introduce the local variations experienced in your area.
Clouds, Moisture and Wind
If an increase in clouds, moisture or wind is expected in the parcel of air being transported into your area, certain modifications must be made. Generally speaking, any or all of these will tend to lower the maximum temperature expected as well as raise the minimum temperature expected.
Cloud Cover
Morning cloud cover can be very misleading. For example, "upstream" weather may indicate overcast skies at all reporting Stations causing a forecaster to "lower" his estimate on forecasted maximum temperatures. However, upon investigation, the forecaster may notice that the HEIGHT of these clouds is below 1000 feet. These low clouds, probably stratus, will most likely "burn off" by mid morning, thus not preventing temperatures from reaching the expected maximum. However, if these low clouds have a higher deck of clouds above them (two or more decks) the sun will probably not be able to penetrate. Overcast skies will persist all day. Lower maximum temperatures can thus be expected.
Rain, Yes or No, When and How Much?
Considerable time will be devoted to this area of forecasting because of its importance.
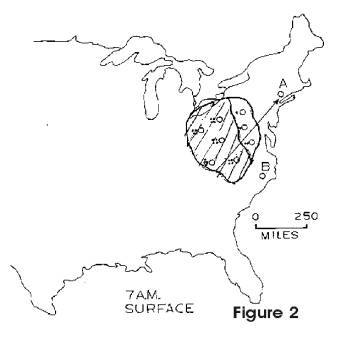
The above factors, yes or no, when and how much can usually be determined very accurately for the next 12 hours by using the surface map in Figure 2, along with the 500 mb.map in Figure 2b.
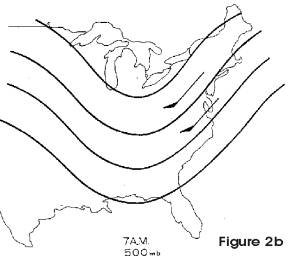
In Figure 2b, the 500 MB. winds indicate the rain area will effect station "A". In fact, light rain (..) should move into the area in approximately six 6 hours. (150 miles divided by 25 MPH). However, the rain should become moderate (...) and heavy (….) after about four (4) hours. (100 miles divided by 25kts) of light rain. Moderate and heavy rain should continue for about 4 hours, tapering off to very light rain showers, then ending.
This method of forecasting appears too simple to work, but it has proven highly successful in operational experience.
Station "B" would not be affected by this rain pattern, since all the rain would be passing to the north of the area.
Here are some factors that may complicate matters:
A Moving 500 MB Trough
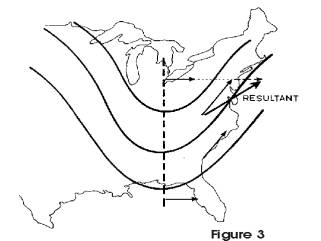
The example given above works well if the trough is stationary. However, if the trough is moving, modifications must be introduced. We must use vectors. The rain pattern will move according to the "resultant of the two vectors, the vectors being 1) direction of the upper air winds plus 2) the eastward movement of the trough. The faster the trough is moving, the greater the eastward component will be in the resultant vector showing the actual movement of precipitation, taking the trough movement into account.
Using the “Strongest Wind Principle” to Forecast the 500 MB Upper Air
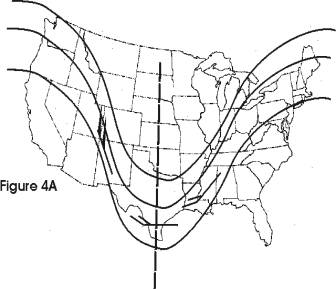
The 500 millibar map in figure 4a shows a trough in the central part of the united states. The strongest winds are “digging” down the western side of the trough. Since the winds are weak at the “bottom” of the trough, this trough will deepen and move eastward very slowly, if it moves at all. We call this a “digging trough”.
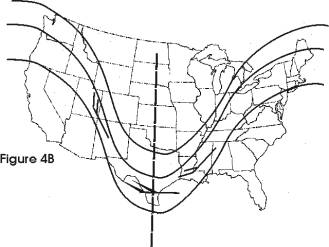
In figure 4b the trough in the central part of the united states with the strongest winds at the bottom of the trough. This trough will remain about the same in intensity but will move eastward.
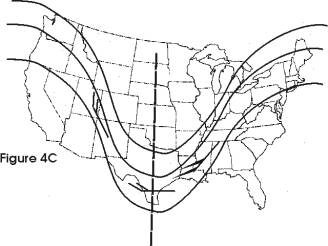
Figure 4c shows the trough in the center of the united states with the strongest winds moving up the eastern side of the trough. This trough will weaken and move rapidly towards the northeast.
A "Lifting Out" Trough
When a trough is lifting out, the area of precipitation, along with the intensity of the precipitation, generally DECREASES. This should be taken into account when determining when precipitation will start, how much will fall, and when it will end.
A "Digging" Trough
When a trough is "digging" the area of precipitation, along with the intensity of the precipitation generally INCREASES. This again must be considered when making a forecast.
A Developing Storm
If rapid storm development (cyclogenesis) is expected, the size of the precipitation area, as well as the precipitation intensities, will increase significantly. This data should then be utilized in modifying amounts and duration of precipitation expected.
Other Factors Influencing Precipitation Amounts and Intensities:
Precipitation is usually associated with fronts. However, depending on various conditions, frontal passage can be nearly "dry" or sometimes soaking. Here are some guidelines.
Time of Cold Frontal Passage:
Cold fronts become most active during late afternoon and evening. Showers and thunderstorms associated with the front become more numerous and heavy at this time. The activity subsides later in the night. Therefore, an approaching front, although "dry" early in the morning and looking very innocent, might produce heavy shower activity in your area if the front is located 50 - 100 miles to the west in the late afternoon. It is possible to get some indication what this front may offer by examining the "weather" associated with this same front the previous afternoon or evening.
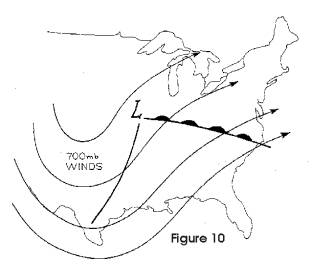
The Influence of the 700 Mb. (10,000 Ft.) Map:
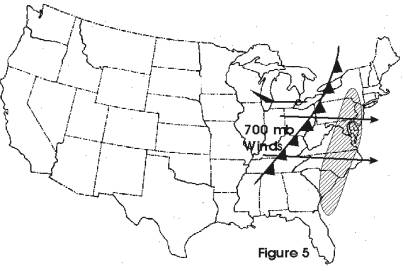
The 700 MB. wind flow gives a good indication of both the location and amounts of expected precipitation associated with fronts. For example, the precipitation occurring with a cold front (Thunderstorms) usually occurs well in advance of the front itself if the 700 MB. winds are PERPENDICULAR to the front.
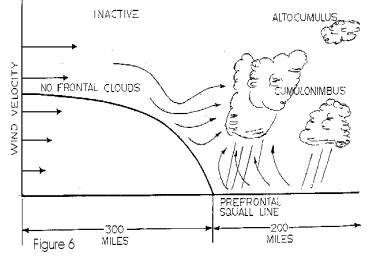
The stronger the 700 MB. winds become, the further in advance of the front the precipitation occurs. Briefly, this can be explained as follows. Winds blowing perpendicularly across the front flow downward over the frontal surface and will be warmed adiabatically. No precipitation will occur. Further in advance of the front, warm air will be converging with warm air already established in the warm sector, rising as it does. Prefrontal clouds and thunderstorms will occur where this UPWARD MOTION takes place. Since no "weather " is occurring along the front itself, such a front is classified as INACTIVE. and generally moves very rapidly.
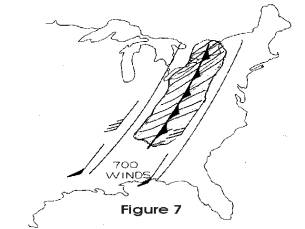
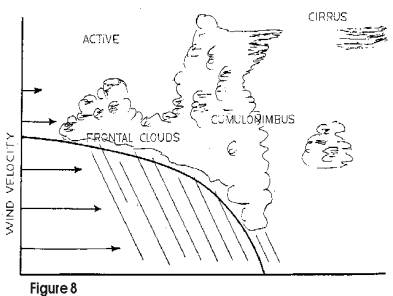
ACTIVE COLD FRONTS are those that have the winds at the 700 MB. level blowing PARALLEL to the orientation of the front.
Precipitation associated with active fronts is usually widespread and occurs both at and behind the front as shown in Figure 8, which is cross-sectional view of the front in Figure 7.
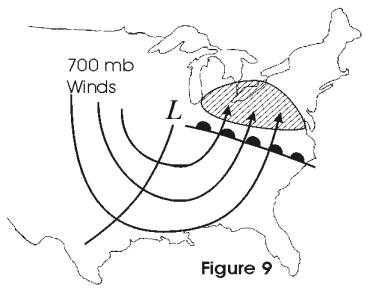
Warm frontal precipitation becomes extensive when the 700 MB winds are PERPENDICULAR to the front and the wind flow above the front is cyclonic.
If the wind flow over the front is ANTICYCLONIC, very little precipitation occurs. In fact, many times it is only partly cloudy.
The "Overrunning" Situation
Overrunning occurs when surface winds are from the NE, E, or SE while winds at the upper levels (700 MB. and 500 MB.) are blowing from the SW or South. The stronger the winds are, the greater the overrunning. The ultimate result of overrunning is precipitation. Very "innocent" situations often produce heavy amounts of precipitation as the classic overrunning pattern becomes established.
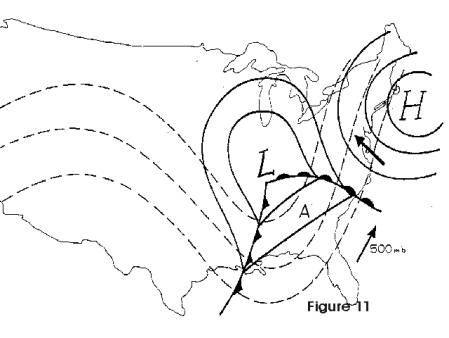
In Figure 11, surface winds around the back of the high-pressure system are blowing from the southeast, while winds at the 500 MB. level are blowing from the southwest in advance of the trough in the Mississippi Valley. If abundant moisture is available (check dew point depressions at the surface, 850 mb.700 MB and 500 MB. levels) excessive rainfall can be expected in the northeastern part of the United States.
Southwest Winds Aloft & Southwest Surface Winds:
In Figure 11 station "A" would experience surface winds from the southwest while the 500 MB. winds would also be blowing from the southwest. Generally, very little, if any, rain is experienced in this "warm sector" of the storm. Showers, however, in advance of the approaching cold front may occur, depending on how active the cold front is. However, prolonged steady rains are almost nonexistent where surface and upper level winds are coincidentally from the SOUTHWEST.
Mountains
Mountains influence precipitation amounts and must be taken into consideration. Precipitation has difficulty crossing the mountains as much of the moisture is "wrung out" on the windward slopes.
Will It Snow or Will It Rain?
A very important question indeed! Below are some rules for determining whether precipitation will be in the form of snow or rain.
The Upstream Method:
Much research and experimentation has been conducted and numerous methods have been devised to accurately forecast whether "it" will be rain or snow. Some of these techniques will be included in this section. However, as in the past, the simplest method (upstream) seems to be the most accurate.
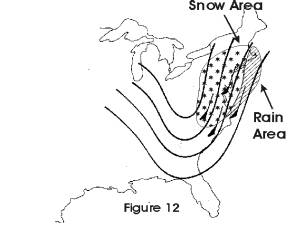
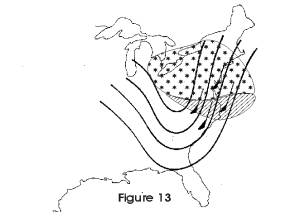
To determine whether an area will experience rain, snow or a mixture of the two, simply MOVE the precipitation in the direction of the 500 mb. winds, at 1/2 their speed. If a "snow area" is to pass over the forecast location, forecast snow. If rain is indicated, forecast rain. If the boundary line between snow and rain will be passing over the forecast area, forecast a MIXTURE of snow and rain. ALTHOUGH THIS METHOD SEEMS TOO SIMPLE, IT IS NONE-THE-LESS EXTREMELY ACCURATE.
Snow often changes to rain. This usually appears on a weather map as follows. In this case, the N.Y.C. area would experience snow at the onset. Snow would continue for about six hours (150 miles divided by ½ the 500 mb. wind speed.) Rain would then take over and last for another six hours. Again, this method is simple but accurate.
Other Methods and Parameters for Snow Versus Rain:
Track of Storm Is Most Important
Generally, for an area to receive a snowstorm, the center of Low Pressure must pass to the south or southeast of the area. This is true for most parts of the United States. For example, as shown in Figure 14, all conditions must be ideal to get the full brunt of an east coast snowstorm.
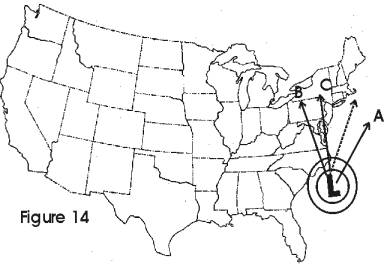
If the storm takes PATH A, the moisture from the storm will fall over the ocean. A storm following this track would bring a partly cloudy sky, blustery northwest winds and probably cooler temperatures to the east coast.
If the storm takes PATH B, the surface winds along the coast will be from the southeast. In the winter season, since the ocean is warmer than the land, the winds would transport warm, moist air to the coast, causing the precipitation to fall in the form of rain.
If the storm takes PATH C, the warm air of the storm itself will move along the east coast causing rain instead of snow to fall along the entire coastline. (Or snow changing to rain).
The path mid way between “A” & “C” is the typical path for the classical northeast snowstorm. (dashed arrow).
The 850 MB Temperature
Generally speaking, a temperature of -3℃ on the 850 MB. map separates rain from snow at the surface. Temperatures of -4℃ indicate snow, while -2℃ or above usually produces rain. However, snow is possible with the 850 MB temperature at or just below the 0℃ mark.
The 700 MB Temperature
The critical temperature at this level is 6 degrees Celsius. Warmer temperatures usually produce rain; colder temperatures produce snow.
The Surface Temperature
Mixed precipitation usually occurs in areas where the surface temperature is about 35 degrees Fahrenheit. Colder temperatures often indicate snow, while temperatures above 35℉ produce rain.
Freezing Level
TWELVE HUNDRED FEET (1200 feet) is the critical FREEZING LEVEL. Snow is likely when the freezing level is below 1200 feet since the snowflakes do not have sufficient time to melt before hitting the surface. A freezing level above 1200 feet usually produces rain.
Thickness (1000-500 MB)
Thickness is exactly what is implied. It is the thickness in meters of a certain layer of the atmosphere. In forecasting rain versus snow, we subtract the height of the 1000 MB. surface from the height of the 500 MB. surface and come up with a THICKNESS VALUE of the layer of air between 1000 MB & 500 MB. This thickness is directly proportional to the over all temperature of that layer of air, it follows that the LOWER the thickness value, the COLDER the air and vice versa. If the height of the 500 MB. surface is 5520 meters (552) and the height of the 1000 MB. surface is 200 meters the 1000-500 MB. thickness would be (5520-200 meters) 5320 meters, commonly referred to as a thickness of 532, by dropping the last digit.
Some forecasters prefer to use empirical thickness charts for deciding whether rain or snow is probable. Below is a chart giving thicknesses for which the probability for snow or rain is equal.
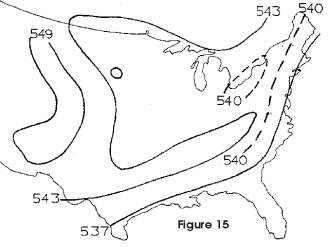
For example, if the "540" thickness line passes through your forecast area (meaning that the calculated 1000-500 mb. thickness of the atmosphere over you is 5,400 meters) then rain or snow is equally probable. If, however, the thickness values over you are lower (meaning a colder atmosphere) then snow is more probable. Higher thickness values usually produce rain.

Figure 16 approximates the probability for UNFROZEN PRECIPITATION (rain) as the departure of observed thickness varies from the EQUAL PROBABILITY THICKNESS.
For example, if the equal probability thickness is 540 (5400 meters) and the observed thickness is 60 meters greater (5400+60=5,460 or546) then using Figure 16 it can be determined that there is about a 78% probability that the precipitation will be unfrozen (rain).
Forecasting Snow Accumulations
How much are we going to get? A very important and often asked question. Below is a simple but accurate method of forecasting snow accumulations. Again we use the UPSTREAM METHOD.
How much are we going to get? A very important and often asked question. Below is a simple but accurate method of forecasting snow accumulations. Again we use the UPSTREAM METHOD.
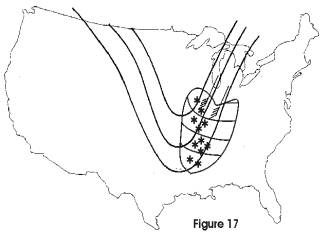
Referring to Fig. 17, we notice an area of snow (light, moderate and heavy) heading for Chicago at 20 Kts. (1/2 the 500 mb. wind speed). Using this speed, light snow will continue for five (5) hours (100 miles divided by 20 mph). MODERATE SNOW will then commence and continue for five (5) more hours. Heavy snow will fall for five (5) hours and then taper back to light snow for an additional five (5) hours. In all, about 20 HOURS of snow will occur. How many inches will accumulate?
Using the reference table below, we can approximate the snow accumulation.
- Very Light Snow 1" every 6 -12 Hours
- Light Snow 1" every 2 - 3 Hours
- Moderate Snow 1" every 1 - 2 Hours
- Heavy Snow Over 1" per Hour
Chicago will have light snow for the first five hours. About 2" of snow will accumulate. Moderate snow for the next 5 hours would produce at least an additional 3, totaling five inches. Then heavy snow begins. Over 1" of snow per hour falls, but it is useful to examine "upstream" stations to see if they are accumulating 1", 2" or even 3" of snow per hour, since similar conditions will eventually move into the forecast area. If all stations seem to be receiving 2" per hour, then expect Ten (10) additional inches to blanket the area. (5 hours X 2" per hour). FIFTEEN inches are now on the ground. Heavy snow tapers off to light snow which continues 5 more hours. Two additional inches will accumulate. All in all, up to 17 inches of snow may be dumped on the area.
To determine whether light, moderate or heavy snow is falling "upstream", examine the station models upstream.
Storm Formation, Intensification & Movement
In this section we will attempt to point out situations and conditions that lend themselves to storm development and intensification.
Storm Support and Weather Forecasts (Study Diagrams Thoroughly)
Relationship of upper air winds (500 mb - 18,000 ft.) to surface storms.
Surface storms (cyclones) will NOT become intense without support from the upper air. A brief discussion of the upper air is necessary in order to explain this support.
Relationship of upper air winds (500 mb - 18,000 ft.) to surface storms.
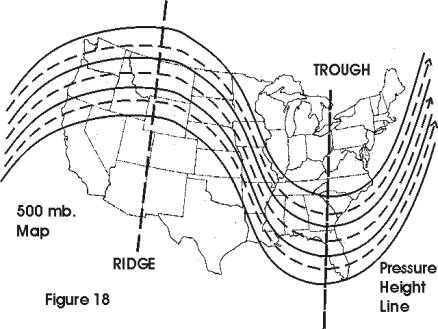
Winds in the upper levels of the atmosphere (18,000 ft) do not just streak across the sky from west to east. Generally, there are waves in these wind patterns.
A RIDGE is a pocket of WARM air and appears as a mountain in Figure 18, while a TROUGH is a pocket of COLD AIR and appears as a valley. The winds (arrows) follow the contours formed by the troughs and ridges. WINDS INCREASE in speed when the PRESSURE HEIGHT LINES are close together.
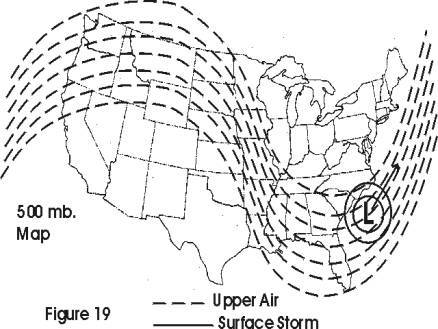
The winds at the upper levels (500 mb. or 18,000 ft) are the STEERING FORCES for the surface weather.(Figure 19) The surface storm located in the Georgia-South Carolina area will move northeastward up the Atlantic seaboard, spreading its associated rain or snow up the coast. The storm will move at a speed of ONE HALF the speed of the winds steering the storm on the 500 MB. map. For example, if the wind speed on the 500 MB. map averages about 50 miles per hour, then the surface storm and its associated precipitation (weather) will advance up the coast at a speed of about 25 miles per hour.
Support for Surface Storms
Storms need support from the upper air. This support comes from the ridges and troughs on the 500 MT. map. (Diagram #3)
LOW PRESSURE SYSTEMS located on the eastern side of the 500 mb. trough have upper air support. Deep troughs with strong winds give the greatest support to developing storms.
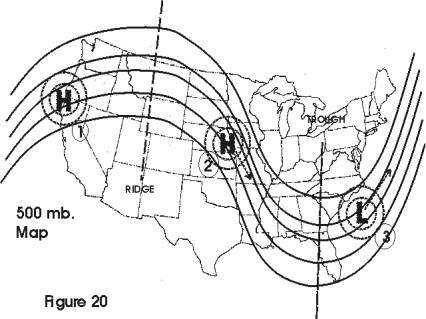
HIGH PRESSURE SYSTEMS located on the western side of the 500 mb. trough have upper air support. A fair weather system (high pressure) will grow larger if located in this part of the trough. A high pressure system on the eastern side of the trough will weaken. A low pressure system on the western side of the trough with weaken. Referring to Figure 20, system number #1 will weaken, while systems numbered #2 & #3 will strengthen.
Other Factors Influencing Storm Development
Certain "conditions" alert the forecaster to possible storm development. They are:
Baroclinicity
Baroclinicity basically means temperature differences. Extreme temperature contrasts over a relatively small surface area often indicate "trouble". Strong frontal zones usually exhibit high baroclinicity.
Approaching Short Wave Trough
TROUGHS in the upper air can be either long wave troughs (B) or short wave troughs (A).
A LONG WAVE TROUGH (B) is usually very deep. It generally shows little or no movement. When it does begin to move, it usually moves very SLOWLY.
A SHORT WAVE TROUGH (A) is usually quite shallow and moves rather rapidly (20-30 MPH) across the map. These short wave troughs are usually associated with fronts or storms on the surface.
Movements of Troughs and Ridges
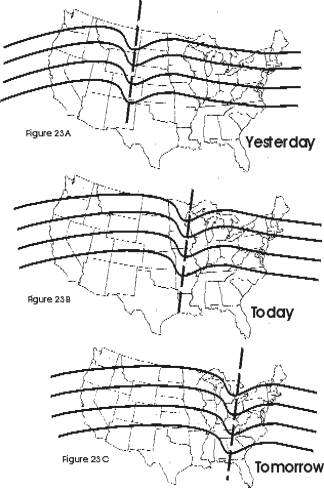
Extrapolation: is generally the most effective way of forecasting the movement of troughs. By calculating the distance traveled between yesterday and today, it is generally possible to determine the troughs probable location tomorrow. (See Figures 23A, 23B & 23c.)
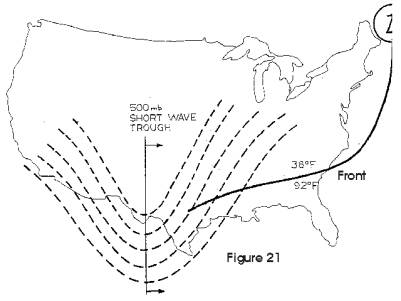
When an area of strong baroclinicity is present (front) an approaching upper level disturbance (short wave trough) is often the "trigger" necessary to initiate storm development. Refer to Figure 21.
Formation of the Secondary Storm (Transfer of Energy)
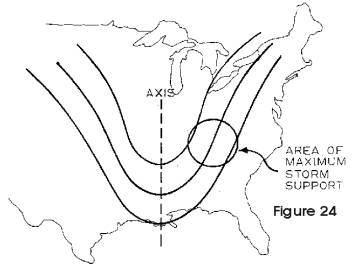
Surface storms horizontally transfer their energy when the upper air support for the storm advances ahead of the system. For example, surface storms get their greatest support when they are approximately 5 degrees (300 miles) east of the trough axis and about HALFWAY "UP" the eastern portion of the trough.
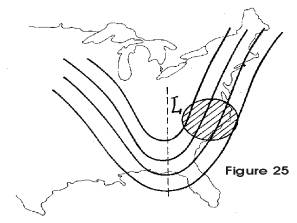
As the upper level trough moves eastward across the country, it may many times "over run" the surface storm. As a result, the surface storm becomes VERTICAL (directly underneath) the trough axis. The storm therefore loses it support. It begins to "FILL", meaning the central pressures begin to rise. The storm is "dying". However, the upper level energy is alive and well, still lending surface support 5 degrees EAST OF THE TROUGH.
The primary storm fades from the map while pressures begin to fall rapidly along the mid-Atlantic coast, heralding the birth of a new storm, the SECONDARY STORM.
This is an extremely common occurrence especially during the winter months and should be anticipated by the meteorologist each time a short wave trough over runs a surface system. East coast storms usually intensify rapidly when the 500 MB. trough axis reaches LONGITUDE 80 West.
Deceleration of Cold Fronts
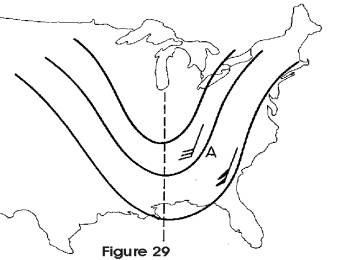
When the forward speed of a cold front decreases, the forecaster should be alerted to possible storm development along the front. ERRATIC PRESSURE TENDENCIES along the front are the first indications of a developing storm. Pressure rises behind the front should be strongest in northern sections and decrease gradually as the southern portion of the front is approached.
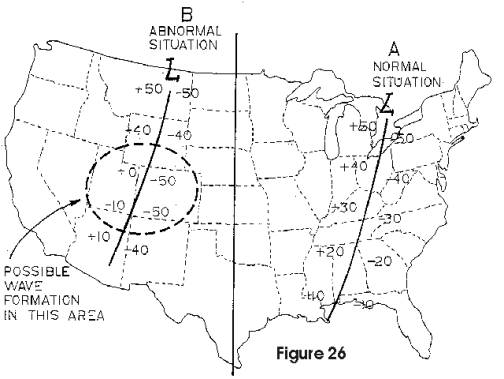
Front "A" shows a typical pattern for a "Moving" cold front. Storm development on this front is unlikely at this time. Front "B" however, exhibits a "suspicious" area in the states of Colorado and Utah. A developing "wave" or storm seems likely in the indicated area.
High Pressure System Moving Off Coast of New England
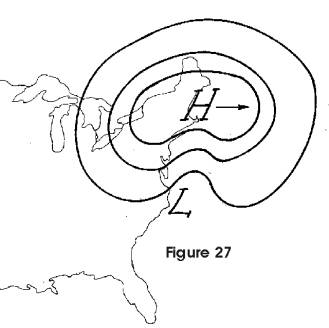
Very cold high pressure systems moving eastward off the coast of New England during the winter months often heralds the onset of CYCLOGENESIS (storm development) along the mid-Atlantic coast in the vicinity of Cape Hatteras, North Carolina. Since this is a favored location for storm development, it should be watched carefully.
Numerous conditions favor storm development. However, the ones cited are most common and should be scrutinized carefully.
Storm Intensification
Certain conditions favor rapid storm intensification. A few are given below.
Cold Air at the 500 MB Level
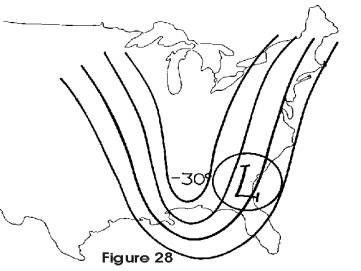
Storms intensify rapidly if the trough (short wave or long wave) possesses cold air. Generally, a temperature of -25℃ to -30℃ at the southern extremity of the supporting trough is sufficient for rapid intensification on the surface.
Generally speaking, the colder the air at the 500 MB. level, the greater the potential for storm deepening.
Vorticity
Storm deepening is usually favored where 500 MB.CYCLONIC WIND SHEAR & CURVATURE EXIST. These are the components of POSITIVE VORTICITY.
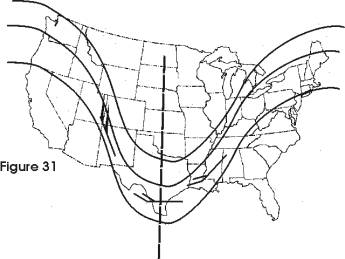
A storm developing near station "A" would deepen rapidly. 500 MB. wind speeds to the east of A are 100 Kts. while to the west of A near the center of the trough, they are only 25 Kts. This creates a counterclockwise (cyclonic) wind shear. The directional curvature at the bottom of the trough also induces cyclonic wind shear. Cyclonic wind shear then is a combination of directional shear and speed shear. This total shear induces rotational motion or circulation. This is commonly referred to by the meteorologist as VORTICITY. The greater the shear, the greater the vorticity. STRONG VORTICITY INDUCES STRONG SURFACE CYCLOGENESIS. Therefore, troughs with very cold air and strong vorticity possess the greatest potential for explosive surface storm development.
Vorticity
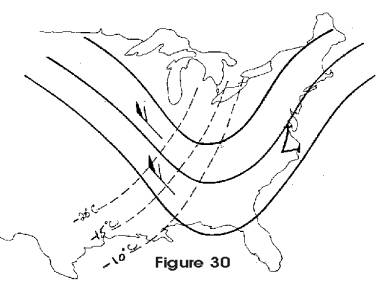
Since a trough is a pocket of cold air, deepening of the trough will occur if more cold air is fed into it. STRONG COLD AIR ADVECTION causes rapid intensification of the trough. This, in turn, often triggers rapid surface intensification east of the trough axis. Generally, 2 or 3 isotherms (less than 60 miles apart) perpendicular to winds stronger than 50 Kts. on the 500 MB. map would be considered favorable for rapid surface cyclogenesis (STORM FORMATION.)
The same rules apply to cold air advection on the 700 MB. map.
The "Digging" Trough
When winds on the western side of the trough are strong and from the north or northwest, trough deepening can be expected. (Especially if weak winds prevail at the base of the trough.) This, in turn, often creates surface cyclogenesis.
Divergence at the 200 MB Level
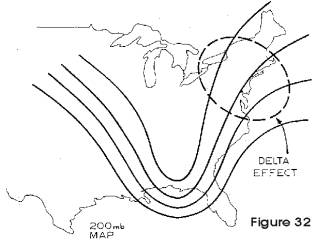
Surface storms deepen rapidly when DIVERGENCE is present at the 200 MB. level (approximately 38,000 ft.).
In Figure 32, divergence is indicated in areas where the contour lines diverge or SPREAD APART. This is known as the DELTA EFFECT. A storm moving northeastward along the Atlantic coast would deepen rapidly as it approached the Delaware, New Jersey shores. The greater the divergence, the greater the storm deepening.
Baroclinicity at the Surface
Earlier we mentioned that storms form in zones of strong baroclinicity (strong temperature gradient). Storms may also deepen under the same conditions. RAPID INTENSIFICATION of a storm can be expected if very cold and dry air is fed into the storm from the NORTH or NORTHWEST while very warm and humid air is introduced into the storm from the SOUTH OR SOUTHEAST. Of course, favorable support must be present at 500 MB. for any good development to take place.
The Jet Stream and Its Influence on Storm Development
The jet stream may be depicted as a tube with high wind speeds meandering through the upper atmosphere. In order to locate the jet stream it is best to use the 300 MB. map (32,000 ft.) during the summer season and the 200 MB. map (38,000 ft.) during winter. Examine these charts for a narrow band of strong winds bounded on both side by regions with lower wind speeds. The jet stream often meanders in the general vicinity of the polar front.
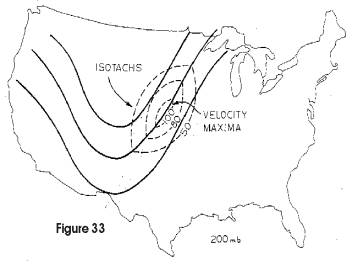
Wind speeds in the jet stream are not constant. Some areas have much higher wind speeds than adjacent locations. Areas having the highest wind speeds are called VELOCITY MAXIMA and those showing the lowest speeds are called VELOCITY MINIMA.
ISOTACHS are lines connecting places that have equal wind speeds.
Associated with the jet stream is WIND SHEAR. The air at A in Figure 34 is located in an area of wind shear and is being induced to circulate COUNTERCLOCKWISE. This occurs NORTH of the jet stream and is known as CYCLONIC WIND SHEAR. The air at "B" (Fig. 33) is also undergoing a wind shear but it is being induced to circulate CLOCKWISE. This occurs to the SOUTH of the jet stream and is known as ANTICYCLONIC WIND SHEAR.
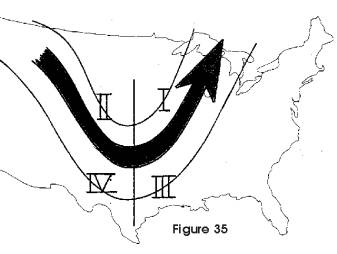
The jet stream provides a clue to the development of lows along the polar front, their intensification as well as the location of their associated precipitation. Generally, storms develop and intensify in AREA I of Figure 35 in connection to the jet stream. AREA I is most favorable because it possesses CYCLONIC WIND SHEAR and also CYCLONIC CURVATURE, both favorable for storm development. AREA III, of Figure 35, also possesses CYCLONIC CURVATURE, favorable for storm development, BUT it also exhibits ANTICYCLONIC WIND SHEAR, unfavorable for storm development, therefore, strong storm development in AREA III would not be expected. AREA II is also not a favored area for storm development because although it has CYCLONIC WIND SHEAR, it also has ANTICYCLONIC CURVATURE.
AREA IV is the least likely area for storm development. In summary then, greatest intensification of storms occurs when the surface storm is located on the eastern edge of a 500 MB. trough, to the left of the jet stream and with a velocity maxima approaching from upstream.
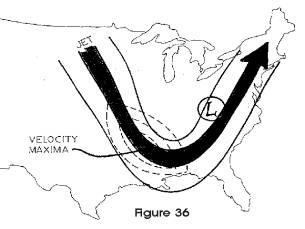
The jet stream also influences the amount of precipitation. Generally, the maximum amount of precipitation coincides with the center of the jet stream. Rainfall usually decreases north and south from this center, but much more rapidly on the south side. Storms become more likely in the United States when the jet stream "digs" deep into the low latitudes, such as it does during the winter. During the summer, when the jet stream is usually located north in Canada, very little storm activity or prolonged rainfall occurs in the continental United States.
Forecasting the Occurrence of Thunderstorms
Thunderstorms are extremely difficult to forecast. No one set of rules will enable a forecaster to be 100%, accurate. Included below, however, are techniques that have proven successful in the forecasting of thunderstorms.
Frontal Considerations
Time of Day
Thunderstorms are more probable when they are associated with cold fronts that are expected to pass through the forecast area during the late afternoon or evening. Cold front passages during the morning hours are rarely accompanied by thunderstorms and often pass “dry”.
Speed of Front
Fast moving cold fronts (25-40 Kts.) are more apt to produce thunderstorms than slow moving fronts (10-15 Kts.)
Strength of Fronts
Strong cold fronts are more apt to produce thunderstorms than weak ones.
Cold Air Advection on the 500 MB Map
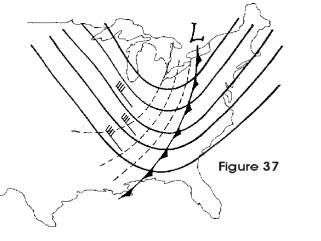
Cold fronts supported by a SHORT WAVE TROUGH most times produce thunderstorms, especially if they pass through during the late afternoon. However, if COLD AIR ADVECTION is occurring into the trough behind the cold front (Figure 37) thunderstorms become almost a certainty. During the summertime, if at least TWO (2) ISOTHERMS (10 degrees C cooling) were located within 60-90 miles apart, this cold air advection would be sufficient to trigger thunderstorms. The stronger the cold air advection at 500 MB the stronger the indication that thunderstorms would be more numerous and more severe.
Upstream Weather
Again, if thunderstorms developed during the afternoon in the parcel of air that will be over your area the following afternoon, it is highly likely that thunderstorms will develop the next afternoon in your area. The "impulse" producing these thunderstorms is likely to carry into your area the following day.
Significance of SSI Values (Showalters Stability Index)
- When the index is +3 or lower, showers are probable and some thunderstorms may be expected in the area.
- When the index is +1 to-2, the chances of thunderstorms increase rapidly.
- When the index is 3 or less, severe thunderstorms can be expected.
- When the index value is below -6, the forecaster should consider the possibility of TORNADO OCCURRENCE.
The Lifted Index (LI)
The significance of the Lifted Index values is as follows: L.I. VALUE RESULTING WEATHER
- +1 or lower Showers are probable and some thunderstorms may be expected in the area.
- -1 to 4 Chances of thunderstorms increases rapidly.
- -5 Severe thunderstorms can be expected.
- -8 Forecaster should consider the possibility of Tornado occurrence.
The K-Index
The K-Indexes are also used to determine the possibility of thunderstorms.
When the K-index values exceed 25, thunderstorms become likely.
Factors Inhibiting Thunderstorm Formation
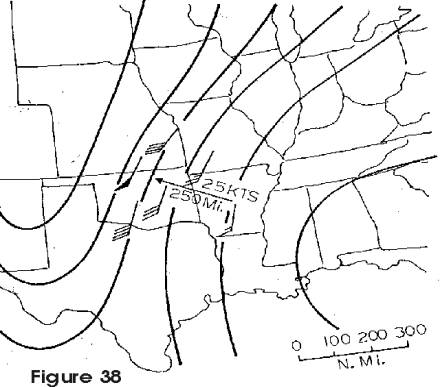
Anticyclonic wind shear and curvature on the 850 MB. map often prevent thunderstorm formation even though favorable air mass conditions for thunderstorms exist. Figure 38 is an example.