Activities for Students - Analyzing Weather Maps
Lab Fronts Worksheet Explanation
- Locate the Low Pressure System
- Draw the Cold Front
- Draw the Warm Front
- Draw the Isobars
- Label All the Isobars
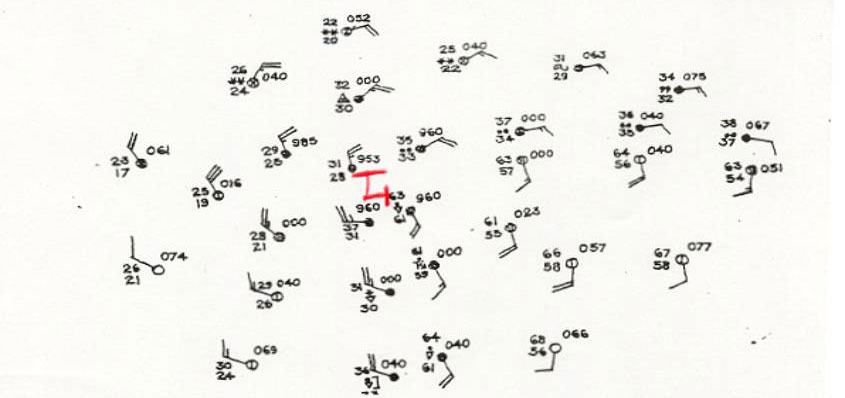
Step 1. Locate the Low Pressure System
Locate the low pressure system using the pressure values and the fact that winds around a LOW circulate counterclockwise.
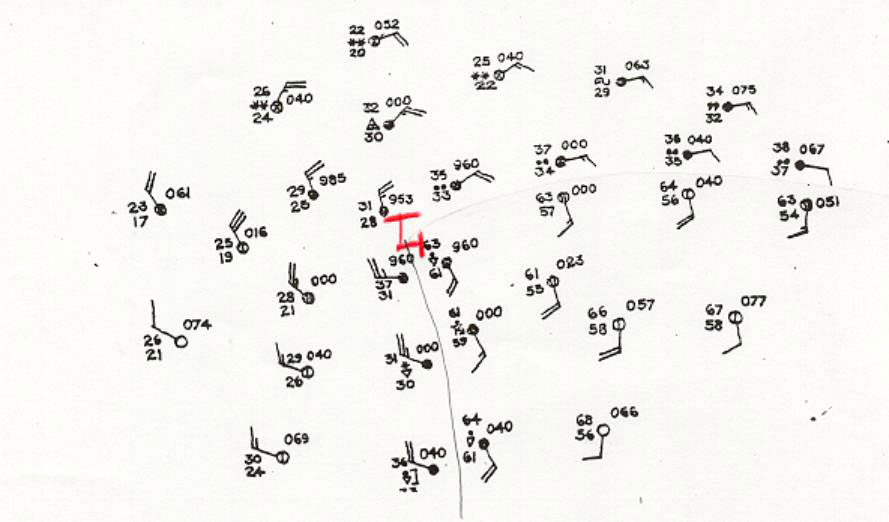
Step 2. Draw the Cold Front
Draw the COLD FRONT, which extends southward from the LOW. Winds in advance of the cold front come from the South and temperatures are warm, while behind the cold front winds are from the Northwest and temperatures are lower. Showers & thundershowers are located along the cold front.
Step 3. Draw the Warm Front
Draw the WARM FRONT. which extends generally eastward from the LOW pressure system. Winds in advance of a warm front usually come from the east or southeast and temperatures are usually cold. Behind the warm front, winds are from the south and temperatures are warmer. Precipitation is usually found north of the warm front, rarely south of the front.
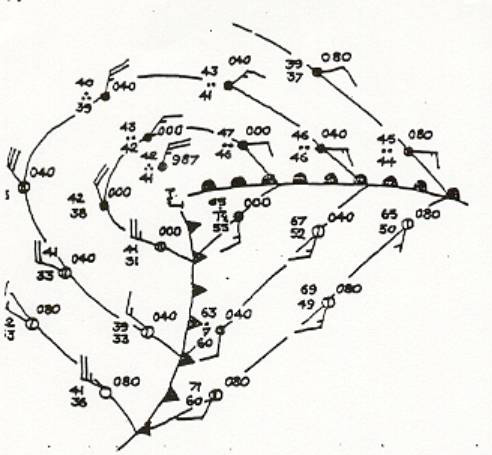
Step 4. Draw the Isobars
Draw the ISOBARS so the pressure interval is 4 millibars apart. Notice the isobars are nearly straight lines in the warm-air sector and also they bend at the fronts away from low pressure.
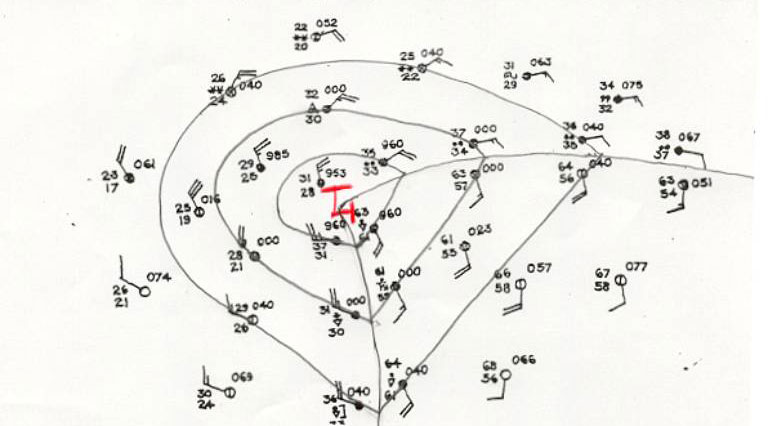
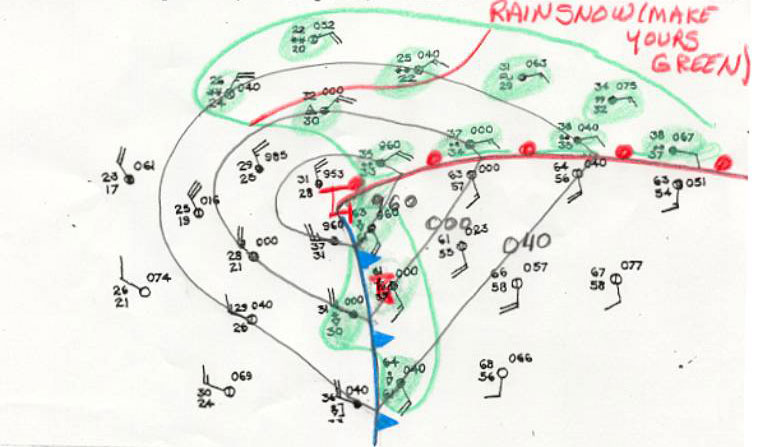
Step 5. Label All the Isobars
Label all isobars, shade precipitation lightly with a green pencil.