Chapter 2 - Air Pressure
The earth's atmosphere is composed of a mixture of gases. Each molecule of gas in the atmosphere is held to the rotating earth by gravity. Being matter, air molecules have weight. It is this weight that causes air pressure.
Air Pressure Highs and Lows and Their Influence on Weather
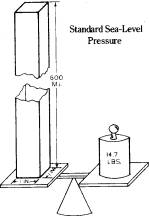
The atmosphere extends 22,000 miles into space. Molecules at the top of the atmosphere exert pressure on the molecules below, creating the most pressure at the surface of the earth. Standard, or average, sea-level pressure is 14.7 pounds per square inch. It is equal to the weight of all the molecules present in a column of air one-inch square in an area 22,000 miles high.
Increasing the number of molecules in this column either at the top, middle, or bottom will increase the weight and, subsequently, the pressure at the surface. Likewise, decreasing the number of molecules will decrease the pressure at the surface of the earth. How and when the molecules are increased or decreased will be discussed later in this chapter.
Measuring Air Pressure
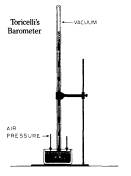
The instrument that measures air pressure is a barometer. There are two types of barometers, mercury and aneroid. In 1643, Toricelli invented the mercury barometer when he inserted a glass tube in a dish of mercury and observed the day-to-day variations in the height of the mercury column.
When the atmospheric pressure was high, the greatest pressure was exerted on the mercury in the dish, causing the mercury in the glass tube to rise. When the pressure was low, the mercury in the glass tube fell.
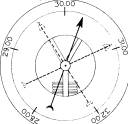
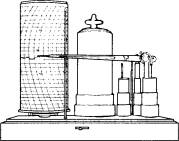
The contemporary aneroid barometer employs a vacuum chamber sensitive to external pressure changes. Contraction and expansion of the vacuum chamber, linked mechanically to an indicator needle, move the needle clockwise when the pressure rises and counterclockwise when the pressure falls. A model of a simple aneroid barometer is shown to the right.
A barograph is a recording aneroid barometer. It uses a rotating drum with a daily, weekly, or monthly chart attached. The chart shows hours of the day and days of the week as well as a pressure scale.
This instrument is extremely helpful in determining pressure changes or pressure "tendencies."
Units Of Air Pressure
In meteorology, air pressure is commonly expressed in units of "inches of mercury" or "millibars." Each can be converted into the other. Earlier, we mentioned that standard sea-level pressure is 14.7 pounds per square inch. This is the same as 29.92 "inches of mercury," or 1013.2 "millibars."
On modern weather charts the millibar is the unit most commonly used to measure barometric pressure. In order to convert inches of mercury to millibars, simply multiply by a factor of 33.86. For example, a pressure reading of 29.10 inches is equivalent to 29.10 x 33.86 or 985.3 millibars. This reading is considered quite low, which means that there probably is a well-developed low-pressure storm system nearby. On the other hand, should the barometer read 30.80 inches, equivalent to 1042.9 millibars, a very strong high-pressure area exists.
Temperature And Moisture - How They Affect Air Pressure
Air pressure is dependent upon two factors, temperature and moisture. Cold air is heavier than warm air and thus exerts higher pressure. In areas where cold air persists for several days, barometer readings are high. On the other hand, low pressure develops where warm air persists.
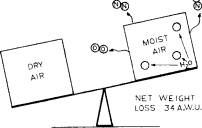
Another important component of our atmosphere is water vapor, or moisture. In order for water vapor to "fit" into the atmosphere, it must replace some of the nitrogen and oxygen. Water vapor is much lighter than either the nitrogen or oxygen whose place it takes, so humid air is lighter than dry air and thus exerts less pressure.
The diagram above illustrates how the lighter H2O molecules replace the heavy nitrogen and oxygen molecules. As water vapor is added, air becomes lighter and pressure decreases. We can determine then that dry air, being heavier than moist air, creates high pressure, while lighter, moist air creates low pressure.
Development Of Pressure Systems
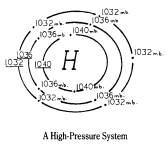
An area of high pressure should be thought of as a "mountain" of cool dry air. At the center of the high-pressure system, the highest barometer readings are found. By observing barometric readings at different stations and locating the stations with the highest readings, we can find the center of a "high" and label it with an "H."
High-pressure systems generally form over cool, dry surfaces. Therefore, most high-pressure areas do indeed take shape over land areas, such as Canada and the Arctic.
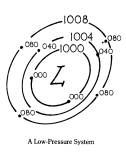
An area of low pressure should be thought of as a "valley" of warm, moist air. At the center of the low-pressure systems the lowest barometer readings are found. By observing barometric readings at different stations and locating stations with the lowest readings, we can find the center of a "low" and label it with an "L."
In Summary
High pressure develops where the air is cold and dry, as in central Canada, while low pressure takes shape where the air is warm and moist, as in the Gulf of Mexico. Barometer readings are important because falling pressure indicates the air is getting either warmer and/or more moist, while rising pressure indicates the air is getting either cooler and/or drier.
Drawing Isobars
Pressure readings are taken hourly throughout the United States at hundreds of weather stations and relayed to the forecaster via high-speed telecommunication circuits. This data is then plotted on maps. Next, isobars are drawn to locate the high-pressure areas and the low-pressure areas. An isobar is a line that connects all places that have the same pressure readings at the same time. A finished drawing is shown below.
Note that all stations reporting a pressure of 1008.0 millibars (abbreviated as 080 by recording only the last 3 digits of 1008.0 and removing the decimal point) have one common isobar running through them. The same goes for stations reporting multiples of 4 millibars above and below 1008.0 millibars. On the right side, we are able to analyze a low-pressure system ("L") because pressures decrease towards the center of the low. On the left side, pressure readings increase towards the center, to a maximum of 200 or 1020.0 mb. So we can label the center of the 1020.0 mb. isobar with an "H" for high.
In this illustration only certain isobars are drawn. Isobars are needed for pressures of 1012.0, 1016.0 and 1020.0. We cannot draw an isobar for 1024.0, because there are no pressures reported that high here. Also, we have drawn isobars for 1008.0, 1004.0 and 1000.0. We cannot draw an isobar for 996.0 because there are no pressures observed to be that low.
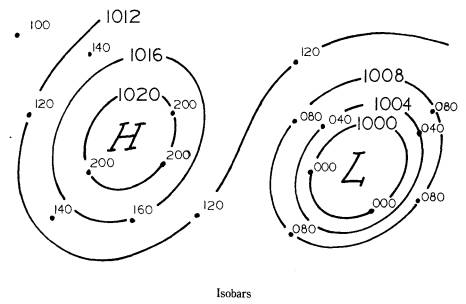
In summary, isobars are normally drawn at intervals of 4 millibars. In order to keep track of which isobars to draw, simply use one of them, such as the even figure of 1000.0 millibars, then add or subtract consecutive intervals of 4 millibars. Remember to draw isobars only for the data given on the map you have plotted. Be sure to draw all the isobars you can for the data given.
The second map shows another simple isobaric analysis. Note again that a pressure of 1004.0 mb. is plotted as 040 by recording only the last three digits of the pressure and dropping the decimal point. If the pressure reading is below 1000 mb., such as 996.0 mb., it is plotted as 960. 960 can never be interpreted as 1096.0 mb., because barometric pressures never get that high. Also, the plotted value 040 can never be interpreted as 904.0 mb., because surface pressures never get that low. Therefore, 040 must be equivalent to a pressure of 1004.0 mb. Worldwide, surface pressures range from the high 900s to the low 1000s.
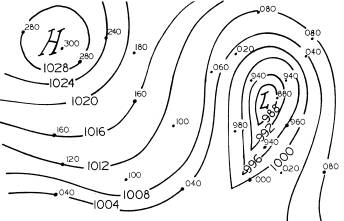
Here's a simple rule to follow: if the plotted value of the pressure begins with a 6, 7, 8, or 9, place a 9 in front of the plotted digits to obtain the actual pressure, and place a decimal point between the last two digits. If the plotted value of the pressure begins with any other number, place a 10 in front of the plotted digits, and, place a decimal point between the last two digits.
Often there are few stations to work with in analyzing a surface pressure map. Yet, all the isobars in intervals of 4.0 millibars should be drawn for values ranging from the highest pressure to the lowest pressure observed on the particular map. Note that on our map above, the highest reading in the center of the high is 300 (1030.0 mb.); yet, we do not draw an isobar of 1030.0 mb. since it is not evenly divisible by the numeral 4. However, we can draw the 1028.0 mb. isobar, the 1024.0, the 1020.0, the 1016.0, etc., all the way down to the 988.0 (plotted as 880), the lowest plotted pressure on the map. 880 is also exactly divisible by 4, so we are permitted to draw that isobar.
In Summary
Draw smooth isobars in intervals of 4 millibars to accommodate all of the data available to you on a particular map. If the value of any isobar you have drawn is not exactly divisible by 4, you have drawn the wrong isobar. It is important that the final analysis be smoothed out to eliminate all bumps or sharp corners in the isobars. You may even have to disregard a pressure reading or two to avoid what seems to be an "out-of-the-question" configuration. Pressure systems generally are smooth in nature, and that is of utmost importance in surface analyses. This skill can be achieved only through constant practice.
Movement Of Pressure Systems
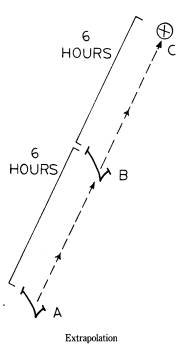
Even this early in the game, it is possible to introduce a commonly used method of forecasting the movement of high- and low-pressure systems. This method is known as extrapolation. If the center of a low were at Point A 6 hours ago, and it is at Point B now, we can extrapolate or forecast the storm to move at its current speed and direction to Point C 6 hours from now.
By using the extrapolation method, the low should be at Point C 6 hours from now, assuming that the low continues at the same rate of speed. If it speeds up, the low will be past Point C after 6 hours. If the low slows down, it will not reach Point C after 6 hours.
The pressure tendency technique is employed daily by forecasters to help them decide where lows and highs will move. Pressure tendency is just what it says, what the tendency of the barometer has been at any given location. Has the pressure fallen, or risen, and, if so, how much? In addition to recording the pressure at the time of observation, each observer records what the pressure has done in the past 3 hours. This is known as the 3-hour pressure tendency. For example, if the pressure at LIT (Little Rock, Arkansas) were 1008.5 mb. three hours ago, and it is now 1002.0 mb., LIT would report a 3-hour pressure tendency of (1008.5 - 1002.0) or a pressure fall of 5.5 millibars. This is recorded on the weather map as -55. (Note that the decimal point again has been dropped.)
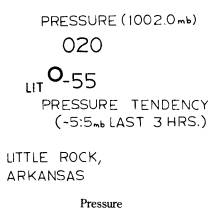
This is how the pressure and pressure tendency would look plotted on a map at LIT.
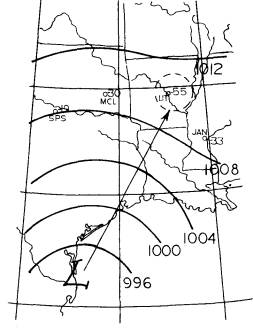
If we know that the pressure at LIT has dropped as much as 5.5 mb. in the past 3 hours, we can come up with two plausible explanations for the effect. Either a low-pressure system is moving toward LIT, or a high-pressure system is moving away from LIT. By studying the isobars on the map, we can decide what is causing the rapid fall. Let us assume that a low is centered near BRO (Brownsville, Texas).
It must be moving in the direction of LIT because all other pressure tendencies are not falling as much as at LIT Therefore, we forecast the low to move northeastward towards LIT.
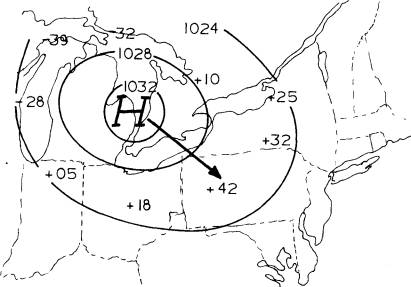
Precisely the same technique can be used with a high-pressure area as shown below. Here, the greatest pressure falls are evident north and west of the high, indicating that the high is moving away from those areas. However, there are strong pressure rises south and east of the high. Therefore, the high will move on a line directly toward the area where the pressures are rising the most rapidly. The two forecasting methods of extrapolation and pressure tendency are extremely important.
If the forecaster can accurately predict both the direction and speed of movement of pressure systems, his/her forecasts will have a high degree of accuracy.